To enter the system monitoring mode, select «Monitoring» from the left-hand side panel.
Some pages do not feature automatic update of the device monitoring data. To obtain the current information from the device, click  button.
Network parameters monitoring
In the «Internet» submenu you may view basic network settings of the device.
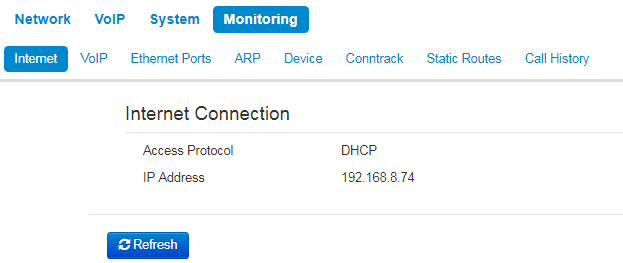
- Access protocol — protocol used for the Internet access.
- IP Address — device IP address in the external network .
VoIP connection monitoring
In 'VoIP' submenu you may view VoIP network interface status and monitor accounts.
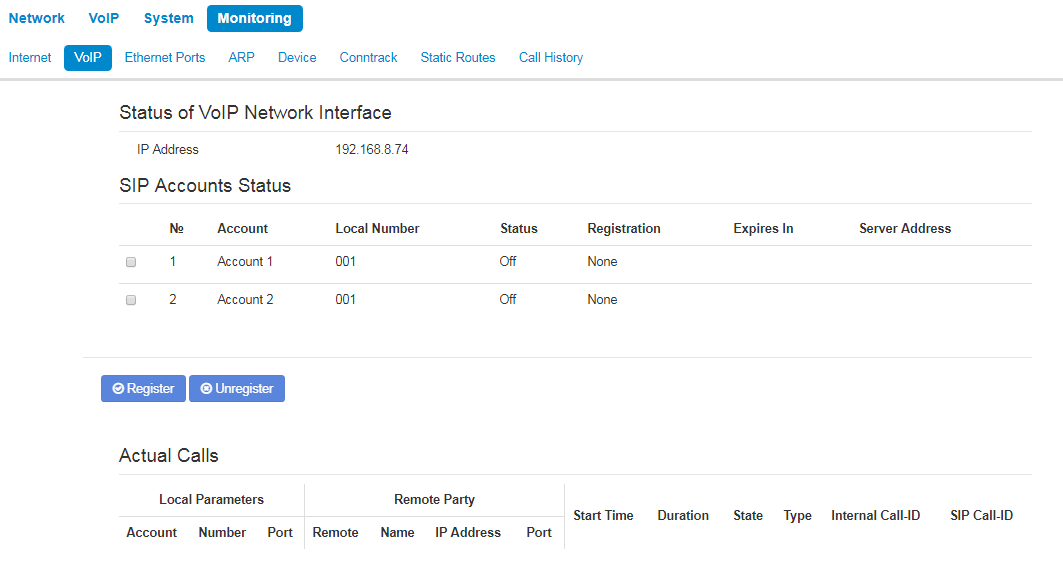
Status of VoIP network interface
IP address — IP address of VoIP network interfce.
SIP Accounts status
- № — a number of account.
- Account — a name of account.
- Local number — subscriber phone number assigned to the current account.
- Status — account status:
- on;
- off.
- Registration — state of registration on proxy server for the group phone number:
- None — SIP server registration function is disabled in SIP profile settings;
- Error — registration was unsuccessful;
- Completed — registration on SIP server successfully completed.
- Expires in — expiration time of account registration on SIP server;
- Server address — address of the server on which the subscriber line has been registered at the last time.
Buttons for forced registration or unregistration of selected accounts are located under the table «SIP accounts status».
Actual calls
Local Parameters
- Account — a name of account through which a call is implemented.
- Number — a phone number assigned on the account.
- Port — RTP stream local port.
Remote Party
- Number — phone number of opposite party.
- Name — opposite party name.
- IP address — IP address of opposite party used for RTP.
- Port — UDP port of opposite party used for RTP stream.
Common parameters
- Start Time — call start time.
- Duration — call duration.
- State — call state. Call might be in the following states:
- call — ring-back tone is issued (if an egress call is implemented);
- incoming calls — ring tone is issued (if there is an incoming call);
- conversation
- on hold
- conference
- Type — call type:
- incoming
- outgoing
- Internal Call-ID
- SIP Call-ID
Ethernet-ports monitoring
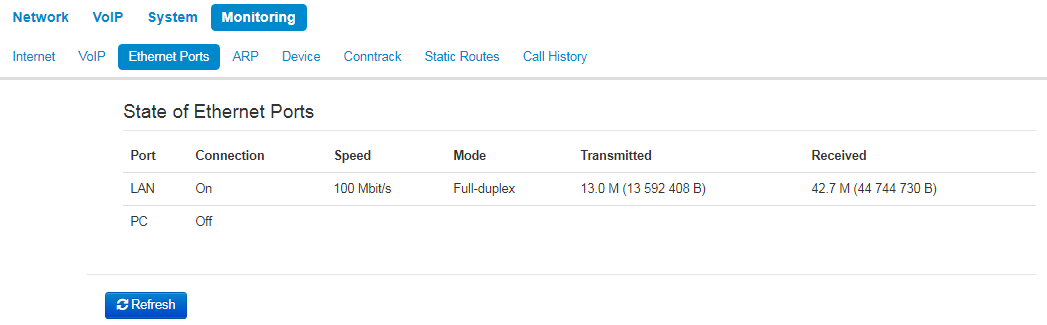
- Port — port name:
- LAN — external network port;
- PC — port for PC connection.
- Connection — state of the connection to the port:
- On — a network device is connected to the port (active link);
- Off — network device is not connected to the port (inactive link).
- Speed — data rate of the external network device connected to the port (10/100/1000Mbps).
- Mode — data transfer mode:
- Full - duplex ;
- Half - duplex .
- Transmitted — quantity of bytes sent from the port.
- Received — quantity of bytes received by the port.
To obtain the current information from the device, click button .
ARP-table
In the 'ARP' submenu you may view an ARP table. In ARP table you may find information on IP and MAC address correspondence for neighbouring network devices.
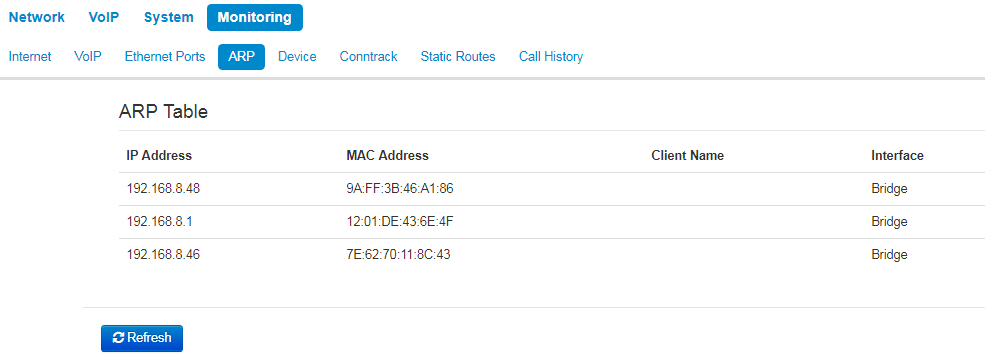
- IP Address — device IP address.
- MAC Address — device МАС address.
- Client Name — connected device network name.
- Interface — interface of the device active side: LAN, PC, and Bridge.
To obtain the current information from the device, click button.
View information on the device
In the «Device» submenu you may find general device information.
.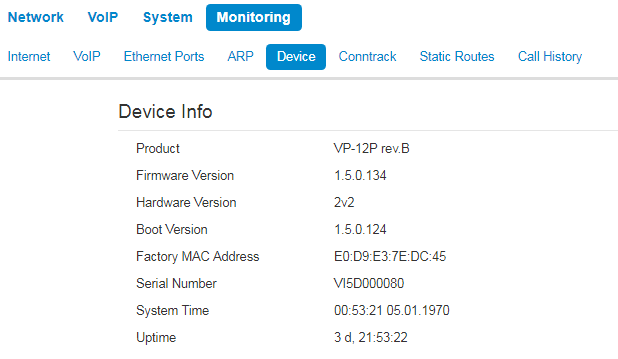
- Product — device model name.
- Firmware Version — device firmware version.
- Hardware Version — device revision .
- Boot Version — software version of the device bootstrap.
- Factory MAC Address — device МАС address defined by the manufacturer.
- Serial Number — device serial number defined by the manufacturer.
- System Time — current date and time defined in the system.
- Uptime — time of operation since the last startup or reboot of the device.
«Conntrack» submenu
In the «Conntrack» submenu you may find the current active network connections of the device.
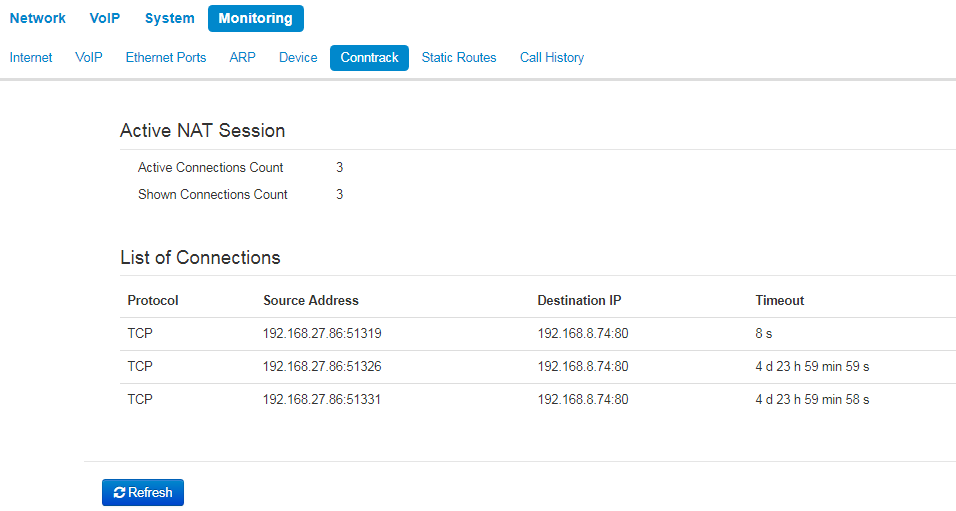
Active NAT session
- Active Connections Count — total number of active network connections.
- Shown Connections Count — number of connections shown in the WEB interface. In order to maintain high performance of the WEB interface, maximum number of connections shown is limited to 1024. You may view other connections with the device command console (cat /proc/net/nf_conntrack).
List of Connections
Protocol — protocol that the connection is being established through;
Source Address — source IP address and port number;
Destination IP — destination IP address and port number;
Timeout — time period until the connection termination.
To obtain the current information from the device, click button.
View the route table
In the «Static Routes» submenu you may view the device route table.
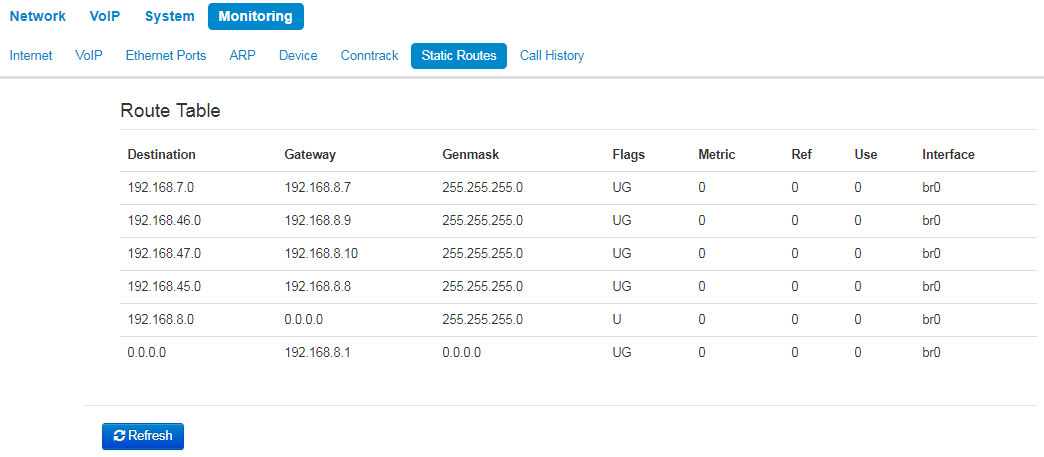
- Destination — IP address of destination host or subnet that the route is established to.
- Gateway — gateway IP address that allows for the access to the «Destination».
- Genmask — subnet mask.
- Flags — specific route attributes. The following flag values exist:
- U — means that the route is created and passable;
- H — identifies the route to the specific host;
- G — means that the route lies through the external gateway. System network interface provides routes in the network with direct connection. All other routes lie through the external gateways. 'G' flag is user for all routes except for the routes in the direct connection networks;
- R — means that the route most likely was created by a dynamic routing protocol running on a local system with the 'reinstate' parameter;
- D — means that the route was added on reception of the ICMP Redirect Message. When the system learns the route from the ICMP Redirect message, the route will be added into the routing table in order to exclude redirection of the following packets intended for the same destination. Such routes are marked with the 'D' flag;
- М — means that the route was modified—likely by a dynamic routing protocol running on a local system with the 'mod' parameter applied;
- А — means buffered route with corresponding record in the ARP table.
- С — means that the route source in the core routing buffer;
- L — means that the route destination is an address of this PC. Such «local routes» exist in the routing buffer only;
- В — means that the route destination is a broadcasting address. Such 'broadcast routes' exist in the routing buffer only;
- I — means that the route is related to the loopback interface. Such 'internal routes' exist in the routing buffer only;
- ! — means that datagrams sent to this address will be rejected by the system.
- Metric — defines route cost. Metrics allows you to sort the duplicate routes, if they are exist in the table.
- Ref — identified number of references to the route for connection establishment (not used by the system).
- Use — number of route detections performed by IP protocol.
- Interface — name of the network interface that the route lies through.
To obtain the current information from the device, click button.
View call history
In the «Call history» submenu you may view the list of performed phone calls and the summary for each call.
The device RAM may store up to 10,000 records for performed calls. If the record number exceeds 10,000, the oldest records (at the top of the table) will be removed, and new ones will be added at the end of the file.
Call log statistics will not be collected, when the history size is zero.
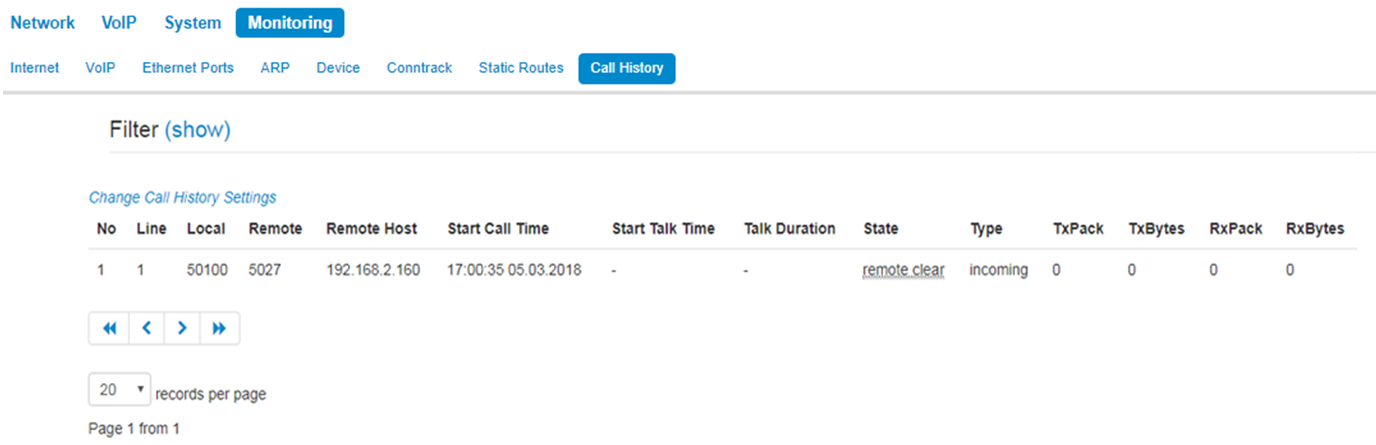
«Call history» table field description:
# — sequence number of the record in the table;
Line — device subscriber port number;
Local number — subscriber number assigned to the current subscriber port;
Remote number — remote subscriber number that the phone connection has been established with;
IP address of the opposite side — remote subscriber IP address that phone connection has been established with;
Start call time — call received/performed time and date;
Start talk time — call start time and date;
Talk duration — call duration in seconds;
State — transient state or reason for call clearing; description becomes available, when you hover the cursor over the call state record;
Type — call type: outgoing or incoming;
TxPack — number of RTP packets sent during the call;
TxBytes — number of bytes sent during the call;
RxPack — number of RTP packets received during the call;
RxBytes — number of bytes received during the call.
In the call history table you may search records by different parameters; to do this, click the «Filter (Show)» link. Filtering may be performed by the subscriber line address, local or remote number, opposite side IP address, call received time, call start time, call state and call type. For filtering parameter description, see call history table field description above.
Call received time from/to or Call start time from/to — call received/performed time period or call start time period in the 'hh:mm:ss dd.mm.yyyy' format.
To hide the table record filtration parameter settings, click the «Hide filter» link.
To configure call history parameters, click 'Configure call history parameters' link. For detailed parameter configuration description, see «Phonebook» submenu.
Click ![]() button to proceed to the table showing the first record.
button to proceed to the table showing the first record.
Click ![]() button to proceed to the previous page with the call history table.
button to proceed to the previous page with the call history table.
Click ![]() button to proceed to the next page with the call history table.
button to proceed to the next page with the call history table.
Click ![]() button to proceed to the table showing the last record.
button to proceed to the table showing the last record.
You may select the number of displayed records at the bottom of the page.